After earning the AWS TryHackMe’s SOC Level 1 learning path and earning the AWS Certified Solutions Architect – Associate certification, I wanted to apply all that I’ve learned. While SOC Level 1 covers a lot, there is one thing that seemed like a valuable skill to me: setting up and configuring a SIEM.
This week, I set out to configure the Elastic Stack, or the ELK Stack, in a cloud lab environment. I also wanted to take this opportunity to pick up a new skill: Terraform. Terraform is a declarative infrastructure as cloud (IaC) tool for cloud environments. I’ve been interested in modern infrastructure and operations tooling lately, so I figured I’d throw this in as well.
My objectives for this project are as follows:
- Configure a server to run the ELK stack.
- Set up the Cowrie honeypot on a separate server and configure it to send logs to the ELK server using Filebeat.
- Provision all infrastructure on AWS using Terraform.
- Automate configuration using Ansible.
With that, we’ll begin with the infrastructure.
Note that all code for this project is hosted and accessible in this GitHub repository.
Provisioning Infrastructure

For this section we will be using Terraform to provision our infrastructure. Our main.tf file will start by defining our provider, AWS.
terraform {
    required_providers {
        aws = {
        source  = "hashicorp/aws"
        version = "~> 5.0"
        }
    }
}

provider "aws" {
    region = "us-east-1"
}
So far, we know that we need two servers: one to host the ELK stack and another for the honeypot. On AWS, we’ll need to provision more than just two EC2 instances to get all of this working, however. We need:
- A VPC to host this lab on a dedicated network.
resource "aws_vpc" "honey_net" {
    cidr_block = "10.0.0.0/16"
    enable_dns_support = true
    enable_dns_hostnames = true

    tags = {
        Name = "honey_net"
    }
}- A subnet for our instances to be a part of.
resource "aws_subnet" "honey_subnet" {
    availability_zone = "us-east-1a"
    vpc_id     = aws_vpc.honey_net.id
    cidr_block = "10.0.1.0/24"
    map_public_ip_on_launch = true

    tags = {
        Name = "honey_subnet"
    }
}- An IGW to give our VPC internet access.
resource "aws_internet_gateway" "honey_gateway" {
    vpc_id = aws_vpc.honey_net.id

    tags = {
        Name = "honey_gateway"
    }
}- A routing table to make the default gateway of instances on our subnet the IGW previously mentioned.
resource "aws_route_table" "honey_route_table" {
    vpc_id = aws_vpc.honey_net.id

    route {
        cidr_block = "0.0.0.0/0"
        gateway_id = aws_internet_gateway.honey_gateway.id
    }

    tags = {
        Name = "honey_route_table"
    }
}

resource "aws_route_table_association" "honey_route_table_association" {
    subnet_id      = aws_subnet.honey_subnet.id
    route_table_id = aws_route_table.honey_route_table.id
}- A security group for the ELK stack server that will allow inbound traffic for Logstash (for the honeypot server), Kibana (for us), and SSH (also for us).
resource "aws_security_group" "elk_server_sg" {
    name = "elk_server_sg"
    description = "Allow inbound traffic on port 22, 5044, 5601"
    vpc_id = aws_vpc.honey_net.id

    # Allow SSH traffic in
    ingress {
        from_port   = 22
        to_port     = 22
        protocol    = "tcp"
        cidr_blocks = ["0.0.0.0/0"]
    }

    # Allow Logstash traffic in from honeypot_server_sg
    ingress {
        from_port   = 5044
        to_port     = 5044
        protocol    = "tcp"
        security_groups = [aws_security_group.honeypot_server_sg.id]
    }

    # Allow Kibana traffic in
    ingress {
        from_port   = 5601
        to_port     = 5601
        protocol    = "tcp"
        cidr_blocks = ["0.0.0.0/0"]
    }

    # Allow all traffic out
    egress {
        from_port   = 0
        to_port     = 0
        protocol    = "-1"
        cidr_blocks = ["0.0.0.0/0"]
    }

    tags = {
        Name = "elk_server_sg"
    }
}- A security group for the honeypot that will allow inbound traffic for our SSH and our honeypotted SSH.
resource "aws_security_group" "honeypot_server_sg" {
    name        = "honeypot_server_sg"
    description = "Allow inbound traffic on port 22 and 2022"
    vpc_id = aws_vpc.honey_net.id

    # Allow SSH honeypot traffic in
    ingress {
        from_port   = 22
        to_port     = 22
        protocol    = "tcp"
        cidr_blocks = ["0.0.0.0/0"]
    }

    # Allow real SSH traffic in
    ingress {
        from_port   = 2022
        to_port     = 2022
        protocol    = "tcp"
        cidr_blocks = ["0.0.0.0/0"]
    }

    # Allow all traffic out
    egress {
        from_port   = 0
        to_port     = 0
        protocol    = "-1"
        cidr_blocks = ["0.0.0.0/0"]
    }

    tags = {
        Name = "honeypot_server_sg"
    }
}- Our 2 EC2 instances. These will use a key pair called
honey_net, which I’ve already created.
resource "aws_instance" "elk_server" {
    availability_zone = "us-east-1a"
    subnet_id     = aws_subnet.honey_subnet.id
    security_groups = [aws_security_group.elk_server_sg.id]
    ami           = "ami-064519b8c76274859"
    instance_type = "t3.large"
    key_name      = "honey_net"
    associate_public_ip_address = true

    root_block_device {
        volume_size = 25
    }

    tags = {
        Name = "elk_server"
    }
}

resource "aws_instance" "honeypot_server" {
    availability_zone = "us-east-1a"
    subnet_id     = aws_subnet.honey_subnet.id
    security_groups = [aws_security_group.honeypot_server_sg.id]
    ami           = "ami-064519b8c76274859"
    instance_type = "t2.micro"
    key_name      = "honey_net"
    associate_public_ip_address = true

    root_block_device {
        volume_size = 8
    }

    tags = {
        Name = "honeypot_server"
    }
}
With a terraform init and terraform apply, all of our infrastructure is up and running.
Installing and Configuring the ELK Stack
Once the EC2 instances are done initializing, we can SSH into the elk_server instance and run sudo su to become root.
First off, we’ll update our system and install the apt-transport-https package, which allows apt to install packages over HTTPS. We also need gpg to import Elasticsearch’s keyring. To access the Debian packages for Elasticsearch, Logstash, and Kibana we have to import the Elasticsearch keyring and add a new source for apt. We can then install the packages we need.
apt update && apt upgrade -y

apt install -y gpg apt-transport-https

wget -qO - "https://artifacts.elastic.co/GPG-KEY-elasticsearch" | gpg --dearmor -o /usr/share/keyrings/elasticsearch-keyring.gpg

echo "deb [signed-by=/usr/share/keyrings/elasticsearch-keyring.gpg] https://artifacts.elastic.co/packages/8.x/apt stable main" | tee /etc/apt/sources.list.d/elastic-8.x.list

apt update && apt install -y elasticsearch logstash kibana
When the installation is finished, save the elastic built-in superuser password for later. Now that we have the ELK stack installed, we have to configure and activate everything, starting with Elasticsearch. This one is easy; just uncomment network.host, http.port, and set network.host to localhost.
# -------------- Network --------------
#
# By default Elasticsearch is only accessible on localhost. Set a different
# address here to expose this node on the network:
#
network.host: localhost
#
# By default Elasticsearch listens for HTTP traffic on the first free port it
# finds starting at 9200. Set a specific HTTP port here:
#
http.port: 9200
#
# For more information, consult the network module documentation.
For now, all we have to do with Logstash is to configure it to automatically reload its configuration when updated. We’ll return to Logstash later after we have our honeypot set up.
# Periodically check if the configuration has changed and reload the pipeline
# This can also be triggered manually through the SIGHUP signal
#
config.reload.automatic: true
#
# How often to check if the pipeline configuration has changed (in seconds)
# Note that the unit value (s) is required. Values without a qualifier (e.g. 60)
# are treated as nanoseconds.
# Setting the interval this way is not recommended and might change in later versions.
#
config.reload.interval: 3s
Next up is Kibana. We need to make Kibana accessible from other devices on port 5601 and configure it to use Elasticsearch.
# ====== System: Kibana Server ======
# Kibana is served by a back end server. This setting specifies the port to use.
server.port: 5601

# Specifies the address to which the Kibana server will bind. IP addresses and host names are both valid values.
# The default is 'localhost', which usually means remote machines will not be able to connect.
# To allow connections from remote users, set this parameter to a non-loopback address.
server.host: 0.0.0.0

...

# ====== System: Elasticsearch ======
# The URLs of the Elasticsearch instances to use for all your queries.
elasticsearch.hosts: ["https://localhost:9200"]
Now that the ELK stack has been configured, we can enable and start everything.
systemctl enable --now elasticsearch
systemctl enable --now logstash
systemctl enable --now kibana
Open up your favorite web browser and navigate to http://ELK_SERVER_DNS_NAME:5601. You should be greeted with the following screen.
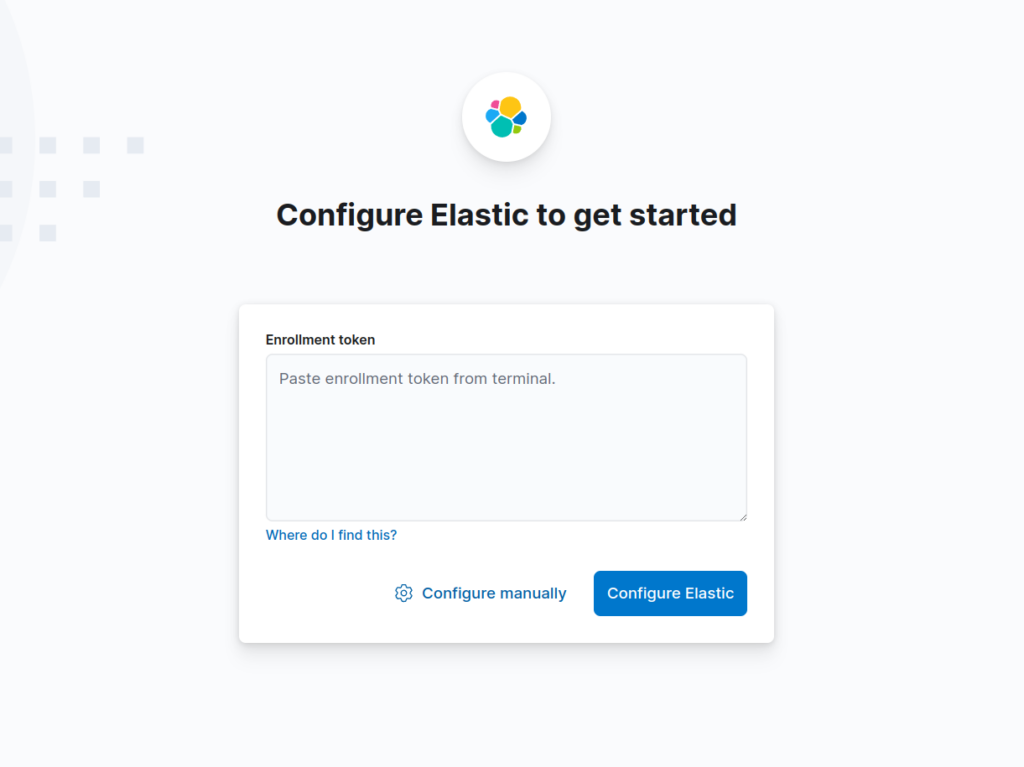
We need to give Kibana Elasticsearch’s access token, which we can generate with the following command.
/usr/share/elasticsearch/bin/elasticsearch-create-enrollment-token -s kibana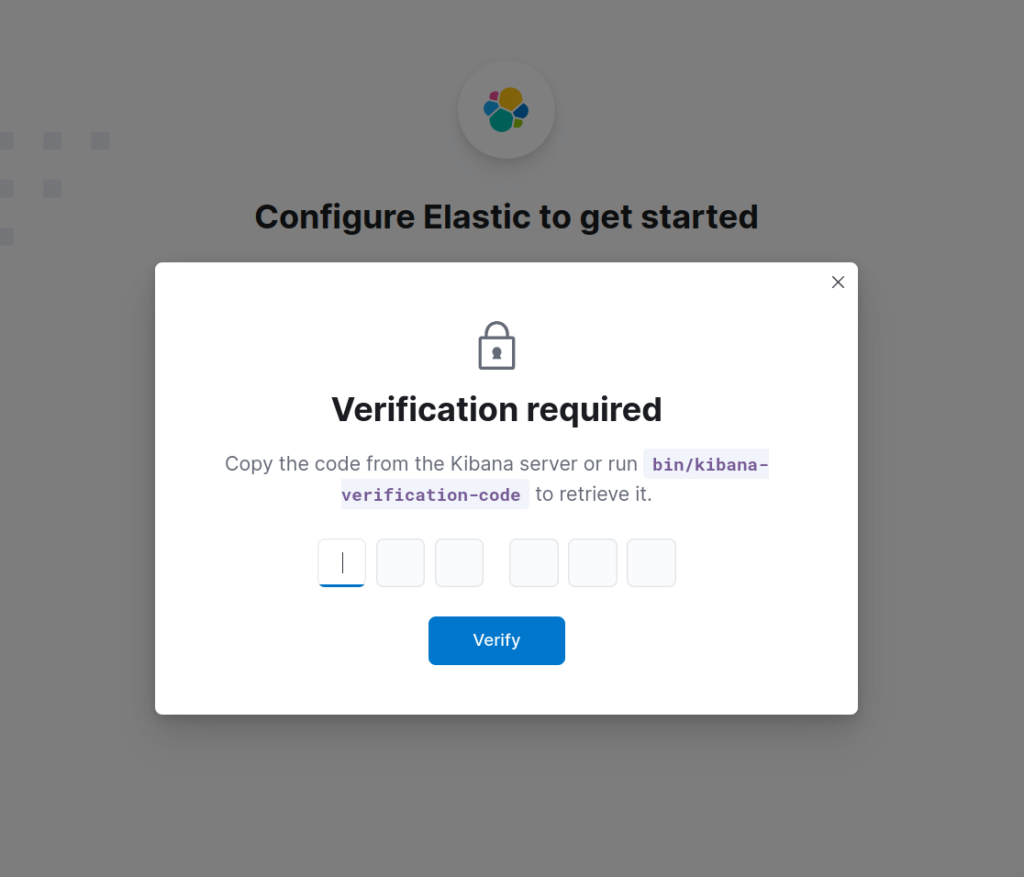
When prompted for verification, use the output of the following command.
/usr/share/kibana/bin/kibana-verification-codeWe’re now prompted with a login screen. Use elastic as the username and the password we saved when installing Elasticsearch. If you didn’t save it, you can generate a new password with the below command.
/usr/share/elasticsearch/bin/elasticsearch-reset-password -u elastic -bAt last, we’ve arrived at the home screen for Kibana and can now move on.
Installing Cowrie
First off, SSH into the honeypot_server instance and run sudo su. We will first upgrade our system and install the packages we need to set up Cowrie.
apt update && apt upgrade -y
apt install -y git python3-venv libssl-dev libffi-dev build-essential libpython3-dev python3-minimal authbind
As recommended, in Cowrie’s installation guide, we will create a new user to run cowrie.
adduser --disabled-password cowrie
su - cowrie
Now we’ll set up the actual program. First, we clone the repository for Cowrie. Next, we set up a virtual environment and install the necessary Python packages.
git clone http://github.com/cowrie/cowrie
cd cowrie
python3 -m venv cowrie-env
source cowrie-env/bin/activate
python -m pip install --upgrade pip
python -m pip install --upgrade -r requirements.txt
At this point, Cowrie should be ready to start. Test it out with ./bin/cowrie start. There is a detail we missed, however. By default, non-root processes are not able to use ports below 1024, meaning that Cowrie cannot listen on the typical SSH port 22. For a honeypot, this is a problem! Thankfully, the authbind package can help us out here. By creating a file /etc/authbind/byport/22 and making cowrie the owner of it, we can allow processes created by the cowrie user to bind to port 22.
touch /etc/authbind/byport/22
chown cowrie:cowrie /etc/authbind/byport/22
chmod 770 /etc/authbind/byport/22
We must also update the configuration for Cowrie to tell it to use port 22 instead of 2022. In ~/cowrie/etc/cowrie.cfg.dist, we’ll go to the “SSH Specific Options” section of the config file and change the 2222 in the listen_endpoints to 22. We can then run exit to become root again.
# Endpoint to listen on for incoming SSH connections.
# See https://twistedmatrix.com/documents/current/core/howto/endpoints.html#servers
# (default: listen_endpoints = tcp:2222:interface=0.0.0.0)
# (use systemd: endpoint for systemd activation)
# listen_endpoints = systemd:domain=INET:index=0
# For both IPv4 and IPv6: listen_endpoints = tcp6:2222:interface=\:\:
# Listening on multiple endpoints is supported with a single space separator
# e.g listen_endpoints = "tcp:2222:interface=0.0.0.0 tcp:1022:interface=0.0.0.0" will result listening both on ports 2222 and 1022
# use authbind for port numbers under 1024

listen_endpoints = tcp:22:interface=0.0.0.0

# Enable the SFTP subsystem
# (default: true)
sftp_enabled = true
There’s still a problem here. The SSH daemon that we use to connect to our instance is also running on port 22. Thankfully, this is an easy thing to change in /etc/ssh/sshd_config. Uncomment the “Port” line towards the top and change 22 to 2022 (note that when you SSH into the instance from now on, you will have to add the -p 2022 flag to your command).
If you started it earlier, stop Cowrie now with /home/cowrie/cowrie/bin/cowrie stop. We’re going to restart sshd and Cowrie.
/home/cowrie/cowrie/bin/cowrie stop
systemctl restart sshd
/home/cowrie/cowrie/bin/cowrie start
ss can be used to confirm that Cowrie is running where we want it to.
cowrie@ip-10-0-1-101:~/cowrie$ ss -tulpn | grep twistd
tcp   LISTEN 0      50             0.0.0.0:22        0.0.0.0:*    users:(("twistd",pid=13344,fd=11))
Now to test out our honeypot. Open a new terminal and try to SSH into the instance. SSH will probably complain that the host key has changed, and this is a valid security measure that we’ll bypass because we’re the ones who changed the host key. Use the below command to test out Cowrie.
ssh -o UserKnownHostsFile=/dev/null -o StrictHostKeyChecking=no admin@EC2-DNS-NAMEEnter a couple random passwords and then return to the terminal where you’re logged in. If we navigate to var/log/cowrie/cowrie.log, we’ll see some failed login attempts.
Logstash & Filebeat
Now that the ELK stack and our honeypot are up and running, it’s time to forward and transform logs. On honeypot_server, Filebeat will forward logs from Cowrie to Logstash on elk_server. Logstash will then transform those logs and send them to Elasticsearch, but it will need an API key to do so. Let’s start with setting up Logstash.
SSH into elk_server and open up the Kibana interface in a web browser. In Kibana, click on the menu icon in the top left and navigate to Management>Stack Management>Security>API keys.
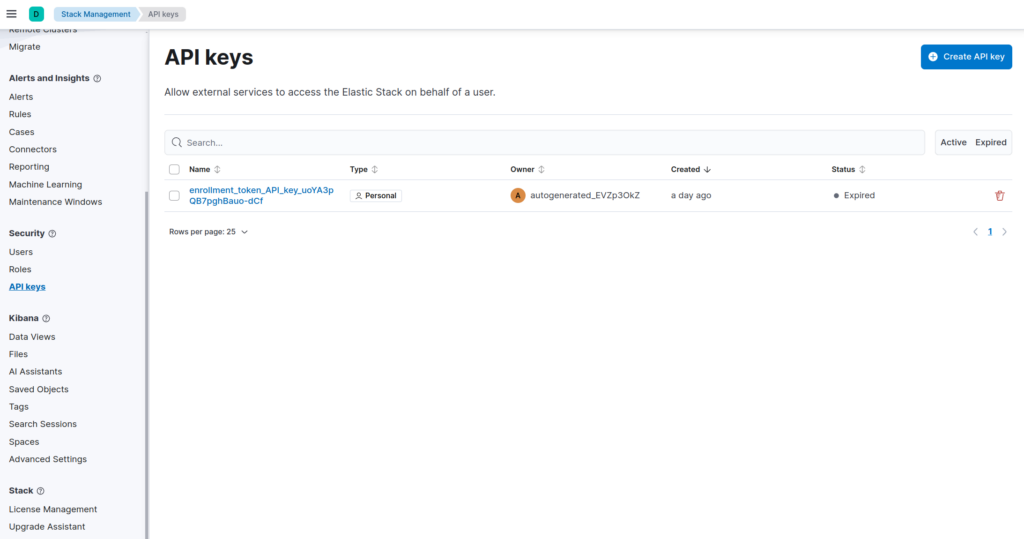
Click on “Create API key”. Name your key whatever you’d like and enable “Control security privileges”. Once you click on create, you will be shown the API key you just created. Click on the drop down labeled “Encoded” and select “Logstash”. Copy that key down, as we will use it shortly.
Now its time to configure Logstash. Create a new file /etc/logstash/conf.d/beats.conf. Logstash has many plugins that fall into 3 unique categories:
- Input: Plugins that define what kind of data will be ingested and from where.
- Filter: Plugins that will manipulate and transform ingested data.
- Output: Plugins that define where the data should be sent to.
We’ll be ingesting data from Beats (particularly Filebeat) and sending it to Elasticsearch. Cowrie logs, by default, are provided in JSON format alongside the .log file we saw earlier. Therefore, transformation should be easy since Logstash has a plugin designed for parsing JSON. Our configuration will look like this:
input {
  beats {
    port => 5044
  }
}

filter {
  json {
    source => "message"
    target => "cowrie"
  }
}

output {
  elasticsearch {
    hosts => ["https://localhost:9200"]
    data_stream => "true"
    api_key => "Vg754pQBesuMQoJgyfFa:GWDlytIuQr66r36kc9xGHQ"
    ssl => true
    ssl_certificate_verification => false
  }
}
Since we set up Logstash to auto-update its configuration earlier, this should take effective right away.
Moving on to honeypot_server, we need to install Filebeat with the below commands.
curl "https://artifacts.elastic.co/downloads/beats/filebeat/filebeat-8.17.1-amd64.deb" > /tmp/filebeat.deb
dpkg -i /tmp/filebeat.deb
Once installed, we can go to /etc/filebeat/filebeat.yml to configure Filebeat. There are a few things we have to do:
- Change the input type to “log”.
- Enable Filebeat’s input by setting
enabled: true. - Change the input path to
/home/cowrie/cowrie/var/log/cowrie/cowrie.json. - Commenting out everything in the “Elasticsearch Output” section.
- Uncomment
output.logstashand set hosts to["ELK_SERVER_PRIVATE_IP:5044"].
# ============================== Filebeat inputs ===============================

filebeat.inputs:

# Each - is an input. Most options can be set at the input level, so
# you can use different inputs for various configurations.
# Below are the input-specific configurations.

# filestream is an input for collecting log messages from files.
- type: log

  # Unique ID among all inputs, an ID is required.
  id: my-filestream-id

  # Change to true to enable this input configuration.
  enabled: true

  # Paths that should be crawled and fetched. Glob based paths.
  paths:
    - /home/cowrie/cowrie/var/log/cowrie/cowrie.json

...

# ---------------------------- Elasticsearch Output ----------------------------
# output.elasticsearch:
  # Array of hosts to connect to.
  # hosts: ["localhost:9200"]

  # Performance preset - one of "balanced", "throughput", "scale",
  # "latency", or "custom".
  # preset: balanced

  # Protocol - either `http` (default) or `https`.
  #protocol: "https"

  # Authentication credentials - either API key or username/password.
  #api_key: "id:api_key"
  #username: "elastic"
  #password: "changeme"

# ------------------------------ Logstash Output -------------------------------
output.logstash:
  # The Logstash hosts
  hosts: ["ELK_SERVER_PRIVATE_IP:5044"]

  # Optional SSL. By default is off.
  # List of root certificates for HTTPS server verifications
  #ssl.certificate_authorities: ["/etc/pki/root/ca.pem"]

  # Certificate for SSL client authentication
  #ssl.certificate: "/etc/pki/client/cert.pem"

  # Client Certificate Key
  #ssl.key: "/etc/pki/client/cert.key"
After saving, enable Filebeat.
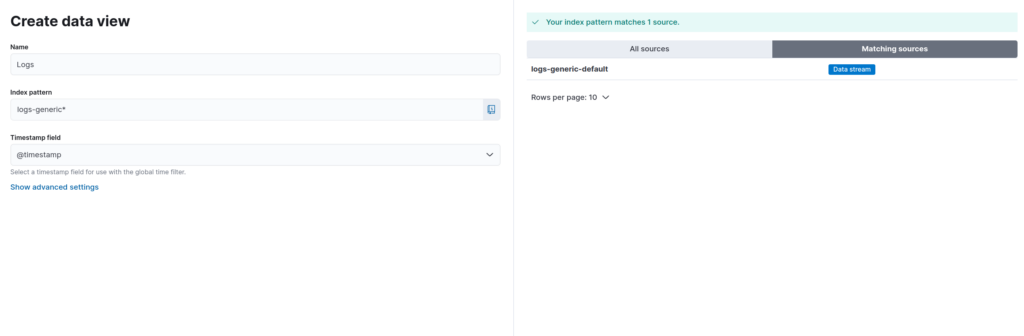
systemctl enable --now filebeatIf everything is working correctly, we should be able to now create a Data View in Kibana. Navigate to Stack Management>Kibana>Data Views and click on “Create data view”. For simplicity, we will create a generic index pattern, as seen below.
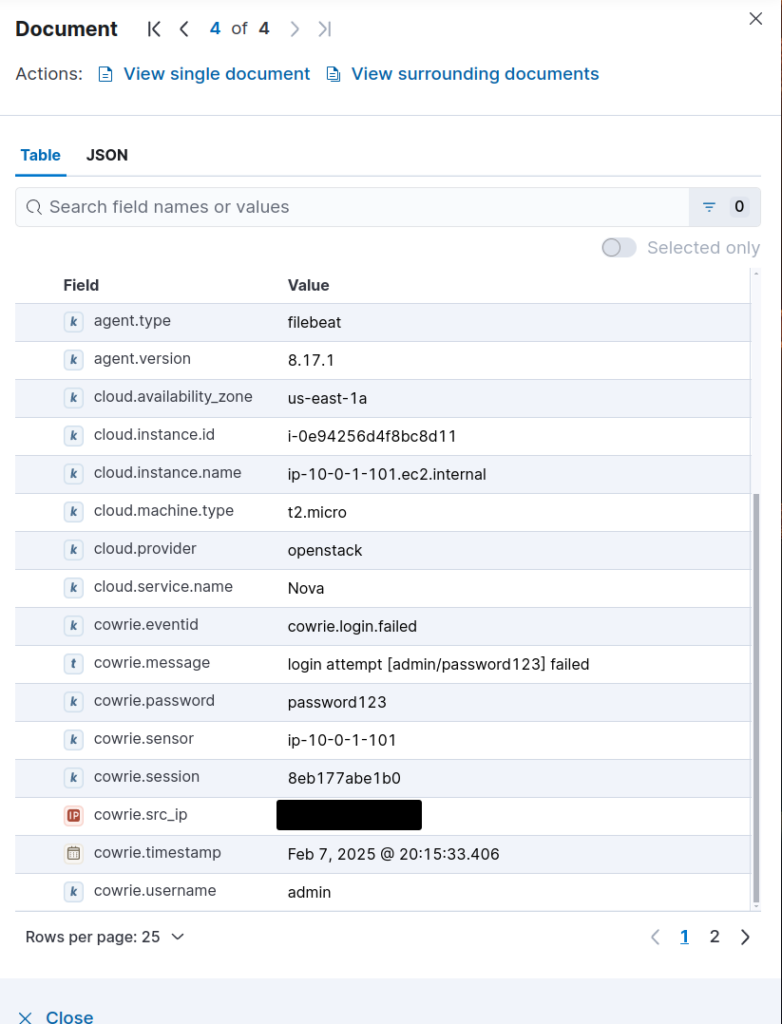
Now click on the menu icon once again and select “Discover”. At last, we can see data coming in from Cowrie.
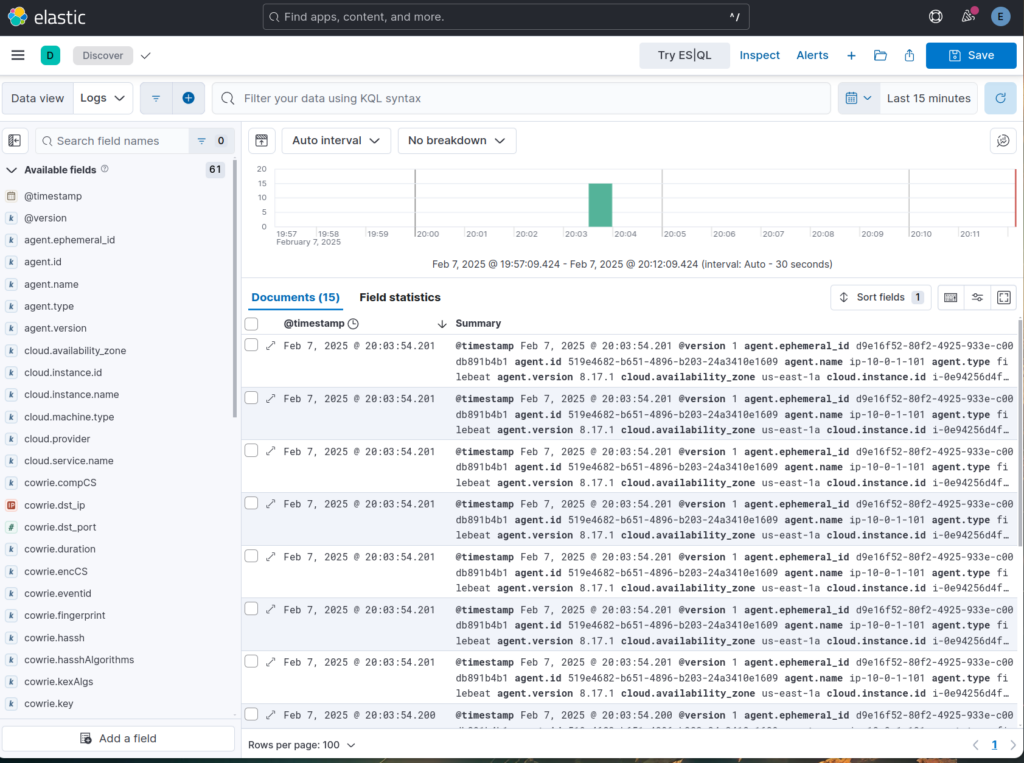
If we attempt to log back into our SSH honeypot, we’ll see new logs get populated in Kibana, even with what passwords we attempted!
Automating with Ansible & Bash
To wrap all of this up, we can automate the configuration of both the honeypot and ELK server using Ansible. Bash can then be used to run the commands to provision infrastructure via Terraform and run our Ansible playbook with a simple ./startup.sh. For the sake of brevity, I will not go over the playbook or script here. Both are available on the GitHub repository for this project.
Conclusion
That concludes this lab. We’ve succesfully:
- Provisioned infrastructure with AWS and Terraform.
- Installed and configured the ELK Stack.
- Installed and configured the Cowrie SSH honeypot.
- Utilized Logstash and Filebeat to forward Cowrie logs to the ELK stack.
- Automated the configuration of the provisioned infrastructure.
I learned a lot about what it is actually like to configure a SIEM with this lab. TryHackMe has a room that has you configure the ELK stack, but it is done in a very hand-holdy way. Configuring it from nothing and forwarding logs from a remote device was significantly more difficult than how things were portrayed there, and I’m glad I learned. That aside, Terraform seems like a very powerful and easy-to-use tool. By using EC2 instance user data, it could be possible to automate the configuration of this entire lab as well! I’m going to continue with projects like these in hopes that they will provide me invaluable experience similar to that which I’ve gained from this lab.